طراحی چارت با HTML5 و JQuery در Asp.Net
چهارشنبه 7 مرداد 1394در این مقاله با ایجاد Chart ها به وسیله HTML5 و Jquery آشنا خواهیم شد و نحوه بکارگیری آن در Asp.Net را فرا خواهید گرفت.

در این مقاله قصد داریم تا با ایجاد انواع چارت از قبیل :
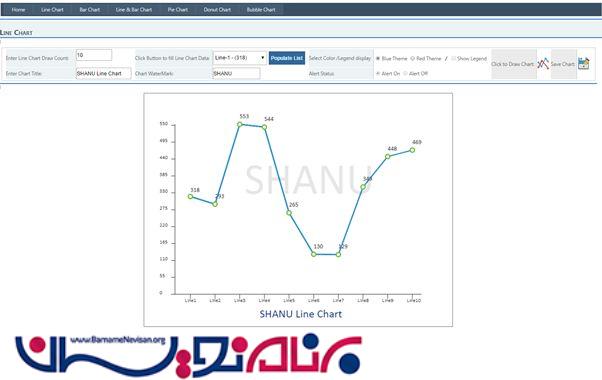
Line Chart (نمودار خطی)
Bar Chart (نمودار میله ای)
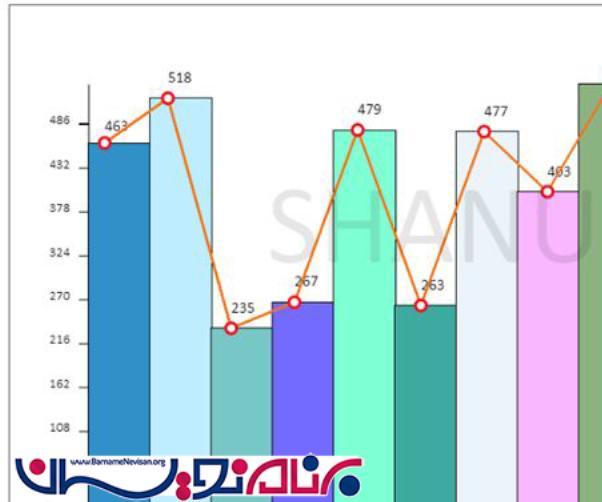
Line & Bar Chart (نمودار خطی و میله ای)
Pie Chart (نمودار دایره ای)
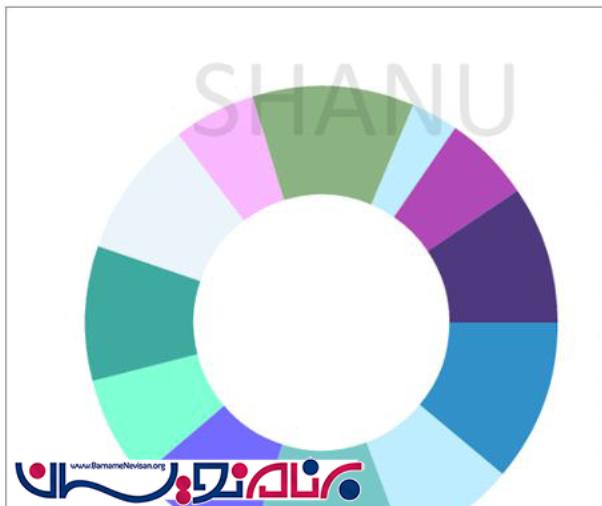
Donut Chart (نمودار دایره ای)
Bubble Chart (نمودار حبابی)
لیست ویژگی هایی که در زیر مشاهده در نمودار های مختلف در نمونه قرار داده شده است :
Chart Source Data (منبع داده نمودار)
Chart Number of Category (تعداد رده در نمودار)
Chart Title Text (عنوان نمودار)
Chart Water Mark Text (علامت گذاری نمودار)
Chart Company LOGO (لوگو کمپانی)
Chart Alert Image (تصویر هشدار نمودار)
The use of an Alert Image (نحوه استفاده از تصویر هشدار)
Chart Color Theme (رنگ و قالب نمودار)
Legend Display (نمایش عنوان)
Save Chart as Image (ذخیره نمودار به عنوان تصویر)
در مرحله اول :
پروژه ای Asp.Net در Visual Studio ایجاد می کنیم.
در مرحله دوم :
یک وب فرم اضافه میکنیم و سپس تگ Canvas را در فرم ایجاد میکنیم.مانند کد زیر :
<SECTION style="border-style: solid; border-width: 2px; width: 800px;">
<CANVAS HEIGHT="600px" WIDTH="800px" ID="canvas">
Your browser is not supporting HTML5 Canvas .Upgrade Browser to view this program or check with Chrome or in Firefox.
</CANVAS>
</SECTION>
در مرحله سوم :
گام به گام شروع به ایجاد یک Chart میکنیم.
ابتدا متغیر های سراسری را برای Chart ایجاد می کنیم.
دقت کنید که طول و عرض نموار بسته به تگ Canvas بزرگ و کوچک می شود.
//public Canvas object to use in all the functions.
//this variable will be used to check for the result of Alert Image display
var alertCheckValue = 300;

//Adding the Pic Chart Colors to array .Here i have fixed to 12 colors and 12 datas to add as Pic Chart.if you want you can add more from here.
var pirChartColor = ["#6CBB3C", "#F87217", "#EAC117", "#EDDA74", "#CD7F32", "#CCFB5D", "#FDD017", "#9DC209", "#E67451", "#728C00", "#617C58", "#64E986"]; // green Color Combinations
// var pirChartColor = ["#3090C7", "#BDEDFF", "#78C7C7", "#736AFF", "#7FFFD4", "#3EA99F", "#EBF4FA", "#F9B7FF", "#8BB381", "#BDEDFF", "#B048B5", "#4E387E"]; // Blue Color Combinations
var lineColor = "#3090C7";
var lineOuterCircleColor = "#6CBB3C";
var lineInnerCircleColor = "#FFFFFF";

//declare the Canvas object
var canvas;
var chartCTX;

// declare the Border Space,Chart Start X and Y Position;
var xSpace = 80;
var ySpace = 80;
//declare the Chart DrawWidth and Hegith
var chartWidth, chartHeight;

// declared the Chart Legend Width and Hegit
var legendWidth, legendHeight;

//declared the Chart data Minimum Value,maximum Value and Noofplots(Bars/Arc and Line points)
var minDataVal, maxDataVal, noOfPlots;

//here we declare the Image for the Chart legend alert status display.
var greenImage = new Image();
var redImage = new Image();
//Alert Image Size widht and hegith
var imagesize = 20;
var maxValdivValue;
//Here we declare the X,YAxis Font size and Color
var fotnColor = "#000000";
var axisfontSize = 10;

var LogoImage = new Image();
var LogoImgWidth = 120;
var LogoImgHeight = 70;
// This arrawy wil be used to draw the Legends
rect = {};
rectInner = {};
اگر از پروژه Webform با MasterPage استفاده می کنید باید ID که MasterPage به کنترل ها می دهد را نیز در کد Jquery در نظر بگیرید مانند زیر :
if ($('#cphBody_rdoColorGreen:checked').val() == "rdoColorGreen")
{
}
در غیر این صورت نیازی به نوشتن شناسه ای که مستر پیج اختصاص می دهد نداریم. (cphBody_)
مانند مثال زیر :
if ($('# rdoColorGreen:checked').val() == "rdoColorGreen")
{
}“
سپس با استفاده از RadioButton می توان به نمودار تم های مختلف داد.
function ChangeChartColor()
{
   if ($('#cphBody_rdoColorGreen:checked').val() == "rdoColorGreen")
   {
         pirChartColor = ["#6CBB3C", "#F87217", "#EAC117", "#EDDA74", "#CD7F32", "#CCFB5D", "#FDD017", "#9DC209", "#E67451", "#728C00", "#617C58", "#64E986"]; // green Color Combinations
         lineColor = "#3090C7"; // Blue Color for Line
         lineOuterCircleColor = "#6CBB3C"; // Green Color for Outer Circle
   }
   else
   {
         pirChartColor = ["#3090C7", "#BDEDFF", "#78C7C7", "#736AFF", "#7FFFD4", "#3EA99F", "#EBF4FA", "#F9B7FF", "#8BB381", "#BDEDFF", "#B048B5", "#4E387E"]; // Blue Color Combinations
         lineColor = "#F87217";  // Orange Color for the Line
         lineOuterCircleColor = "#F70D1A "; // Red Color for the outer circle
   }
}
سپس یک تابع عمومی برای استفاده همه نمودار ها و مشخص کردن مختصات نمودار از (X,Y) برای رسم استفاده می شود.
function getXPlotvalue(val)
{
    return (Math.round((chartWidth - xSpace) / noOfPlots)) * val + (xSpace * 1.5)-24;
}

// Return the y pixel for a graph point
function getYPlotVale(val)
{
    return chartHeight - (((chartHeight - xSpace) / maxDataVal) * val);
}
بار دیگر یک متد عمومی برای استفاده همه نمودار ها برای رسم Legend نمودار (عنوان درجی روی هر قسمت نمودار به عنوان مثال عنوان درجی در هر قسمت از نمودار ) با جاوااسکریپت می نویسیم.
// This function is used to draw the Legend
function drawLengends()
{
    ctx.fillStyle = "#7F462C";
    ctx.fillRect(rect.startX, rect.startY, rect.w, rect.h);
    //Drawing Inner White color Rectange with in Above brown rectangle to plot all the Lables with color,Text and Value.
    ctx.fillStyle = "#FFFFFF";
    rectInner.startX = rect.startX + 1;
    rectInner.startY = rect.startY + 1;
    rectInner.w = rect.w - 2;
    rectInner.h = rect.h - 2;
    ctx.fillRect(rectInner.startX, rectInner.startY, rectInner.w, rectInner.h);
    labelBarX = rectInner.startX + 4;
    labelBarY = rectInner.startY + 4;
    labelBarWidth = rectInner.w - 10;
    labelBarHeight = (rectInner.h / noOfPlots) - 5;
    colorval = 0;
    // here to draw all the rectangle for Lables with Image display
    $('#cphBody_DropDownList1 option').each(function ()
    {
        ctx.fillStyle = pirChartColor[colorval];
        ctx.fillRect(labelBarX, labelBarY, labelBarWidth, labelBarHeight);
     // Here we check for the rdoAlert Status is On - If the Alert is on then we display the Alert Image as per the  Alert check value.
        if ($('#cphBody_rdoAlaramOn:checked').val() == "rdoAlaramOn")
        {
           // Here we can see fo ever chart value we check with the condition .we have initially declare the alertCheckValue as 300.
           //so if the Chart Plot value is Greater then or equal to the check value
           then we display the Green Image else we display the Red Image.
           //user can change this to your requiremnt if needed.This is optioan function for the Pie Chart.
           if (parseInt($(this).val()) >= alertCheckValue)
           {
               ctx.drawImage(greenImage, labelBarX, labelBarY + (labelBarHeight / 3) - 4, imagesize, imagesize);
           }
           else
           {
               ctx.drawImage(redImage, labelBarX, labelBarY + (labelBarHeight / 3) - 4, imagesize, imagesize);
           }
        }
        //Draw the Pie Chart Label text and Value
        ctx.fillStyle = "#000000";
        ctx.font = '10pt Calibri';
        ctx.fillText($(this).text(), labelBarX + imagesize + 2, labelBarY + (labelBarHeight / 2));

        // To Increment and draw the next bar ,label Text and Alart Image.
        labelBarY = labelBarY + labelBarHeight + 4;
        //  labelTextYXVal = labelBarY + labelBarHeight - 4;

        colorval = colorval + 1;
    });
}
در مرحله بعد اقدام به نوشتن متدی برای ترسم نمودار با نام ()DrawChart می نویسیم.
در این متد 7 قسمت یا گام داریم که در کامنت ها از Step1 تا Step7 مشخص شده اند.
function drawChart()
{
    ChangeChartColor();
    // asign the images path for both Alert images
    greenImage.src = '../images/Green.png';
    redImage.src = '../images/Red.png';
    LogoImage.src = '../images/shanu.jpg';
    // Get the minumum and maximum value.here i have used the hidden filed from code behind wich will
        stored the Maximum and Minimum value of the Drop down list box.
    minDataVal = $('#cphBody_hidListMin').val();
    maxDataVal = $('#cphBody_hidListMax').val();
    // Total no of plots we are going to draw.
    noOfPlots = $("#cphBody_DropDownList1 option").length;
    maxValdivValue = Math.round((maxDataVal / noOfPlots));
    //storing the Canvas Context to local variable ctx.This variable will be used to draw the Pie Chart
    canvas = document.getElementById("canvas");
    ctx = canvas.getContext("2d");
    //globalAlpha - > is used to display the 100% opoacity of chart .because at the bottom of
         the code I have used the opacity to 0.1 to display the water mark text with fade effect.
    ctx.globalAlpha = 1;
    ctx.fillStyle = "#000000";
    ctx.strokeStyle = '#000000';
    //Every time we clear the canvas and draw the chart
    ctx.clearRect(0, 0, canvas.width, canvas.height);

    //If need to draw with out legend for the Line Chart
    chartWidth = canvas.width - xSpace;
    chartHeight = canvas.height - ySpace;
    //  step 1) Draw legend $$$$$$$$$$$$$$$$$$$$$$$$$$$$$$$$$$$$$$$$$########################
    if ($('#cphBody_chkLegend:checked').val() == "on")
    {
         chartWidth = canvas.width - ((canvas.width / 3) - (xSpace / 2));
         chartHeight = canvas.height - ySpace - 10;

         legendWidth = canvas.width - ((canvas.width / 3) - xSpace);
         legendHeight = ySpace;

         rect.startX = legendWidth;
         rect.startY = legendHeight;
         rect.w = canvas.width / 3 - xSpace - 10;
         rect.h = canvas.height - ySpace - 10;
         //In this method i will draw the legend with the Alert Image.
         drawLengends();
     }
     // end step 1) $$$$$$$$$$$$$$$$$$$$$$$$$$$$$$$$$$$
     var chartMidPosition = chartWidth / 2 - 60;

      ////        //If need to draw with legend
      ////        chartWidth = canvas.width - ((canvas.width / 3) - (xSpace / 2));
      ////        chartHeight = canvas.height - ySpace - 10;

      // Step 2 ) +++++++++++++ To Add Chart Titel and  Company Logo
      //To Add Logo to Chart

      var logoXVal = canvas.width - LogoImgWidth - 10;
      var logolYVal = 0;

      //here we draw the Logo for teh chart and i have used the alpha to fade and display the Logo.
      ctx.globalAlpha = 0.6;

      ctx.drawImage(LogoImage, logoXVal, logolYVal, LogoImgWidth, LogoImgHeight);

      ctx.globalAlpha = 1;

      ctx.font = '22pt Calibri';
      ctx.fillStyle = "#15317E";
      ctx.fillText($('#cphBody_txtTitle').val(), chartMidPosition, chartHeight + 60);


      ctx.fillStyle = "#000000";
      ctx.font = '10pt Calibri';

      // end step 2) +++++++++++ End of Title and Company Logo Add

      // Step 3 ) +++++++++++++ toDraw the X-Axis and Y-Axis

      //  >>>>>>>>> Draw Y-Axis and X-Axis Line(Horizontal Line)
      // Draw the axises
     ctx.beginPath();
     ctx.moveTo(xSpace, ySpace);
     // first Draw Y Axis
     ctx.lineTo(xSpace, chartHeight);

     // Next draw the X-Axis
     ctx.lineTo(chartWidth, chartHeight);
     ctx.stroke();
     //  >>>>>>>>>>>>> End of X-Axis Line Draw
     //end step 3) +++++++++++++++++++++++


     // Step 4) <<<<<<<<<<<<<<<<<<<<<<< To Draw X - Axis Plot Values <<<<<<<<<<<<< }}}}}}
     // Draw the X value texts
     // --->>>>>>>>>>>>  for the Bar Chart i have draw the X-Axis plot in  drawBarChart
     //  <<<<<<<<<<<<<<<<<<<<<<< End of X Axis Draw

     // end Step 4) <<<<<<<<<<<<<<<<<<<<<<<

     // Step 5){{{{{{{{{{{{
     // {{{{{{{{{{{{{To Draw the Y Axis Plot Values}}}}}}}}}}}}}}
     var vAxisPoints = 0;
     var max = maxDataVal;
     max += 10 - max % 10;
     for (var i = 0; i <= maxDataVal; i += maxValdivValue)
    {

       ctx.fillStyle = fotnColor;
       ctx.font = axisfontSize + 'pt Calibri';
       ctx.fillText(i, xSpace - 40, getYPlotVale(i));

       //Here we draw the Y-Axis point line
       ctx.beginPath();
       ctx.moveTo(xSpace, getYPlotVale(i));

       ctx.lineTo(xSpace - 10, getYPlotVale(i));
       ctx.stroke();
       vAxisPoints = vAxisPoints + maxValdivValue;

    }

   //{{{{{{{{{{{{{{ End of Y- Axis Plot Values

   //end  Step 5) {{{{{{{{{{{{{{{{{{


   //Step 5) *********************************************************
   //Function to Draw our Chart here we can Call/Bar Chart/Line Chart or Pie Chart

   // to Draw Bar Chart
   drawBarChart();

   // to Draw line Chart
   drawLineChart();
   // end step 6) **************

   //Step 7)  :::::::::::::::::::: to add the Water mark Text

   // Here add the Water mark text at center of the chart
   ctx.globalAlpha = 0.1;
   ctx.font = '86pt Calibri';
   ctx.fillStyle = "#000000";
   ctx.fillText($('#cphBody_txtWatermark').val(), chartMidPosition - 40, chartHeight / 2);

   ctx.font = '10pt Calibri';
   ctx.globalAlpha = 1;
   /// end step 7) ::::::::::::::::::::::::::::::::::::::
}
این روش ، روشی کلی برای رسم چارت بود ولی ما می خواهیم چارت های مختلف با قالب های مختلفی را ایجاد و از آن استفاده کنیم.
برای مثال قصد داریم نمودار میله ای نیز رسم کنیم.
پس با جاوااسکریپت متدی برای آن می نویسیم.که بر حسب X و Y نموداری را رسم کند.
function drawBarChart()
{
     var XvalPosition = xSpace;
     widthcalculation = parseInt(((parseInt(chartWidth) - 100) / noOfPlots));
     colorval = 0;
     $('#cphBody_DropDownList1 option').each(function () {

         // Draw Xaxis Plots Line and Text   ***********
         XvalPosition = XvalPosition + widthcalculation;
         ctx.moveTo(XvalPosition, chartHeight);
         ctx.lineTo(XvalPosition, chartHeight + 15);
         ctx.stroke();
         ctx.fillStyle = "#000000";
         ctx.font = '10pt Calibri';
         ctx.fillText('Bar' + parseInt(colorval + 1), XvalPosition - 28, chartHeight + 24);

         //  End Xval Plotting  ************

         //Draw Bar Graph  **************==================********************

         var barRatio = parseInt($(this).val()) / maxDataVal;
         //alert(ratio)
         var barfillHeight = parseInt(barRatio * (parseInt(chartHeight - xSpace)));
         // alert(barHeight)
         ctx.fillRect(XvalPosition - widthcalculation - 1, chartHeight - 1, widthcalculation + 2, -barfillHeight);
         ctx.fillStyle = pirChartColor[colorval];
         //  e.DrawRectangle(B1pen, XvalPosition_Start, Ystartval, XvalPosition_new, YEndval);
         ctx.fillRect(XvalPosition - widthcalculation, chartHeight, widthcalculation, -barfillHeight);

         //ctx.fillRect(XvalPosition - widthcalculation, yLineHeight, widthcalculation, yLineHeight- parseInt($(this).val()));
         // *****

         //////            ctx.fillStyle = "#000000";
         //////            ctx.font = '10pt Calibri';
         //////            ctx.fillText($(this).val(), XvalPosition - widthcalculation + 4, chartHeight - barfillHeight - 8);
         ctx.fillStyle = pirChartColor[colorval];

         //END Draw Bar Graph  **************==================********************
         colorval = colorval + 1;
     });
 }
برای ترسیم انواع نمودار مطابق کد های زیر اقدام به ایجاد توابع مختلف می کنیم.
برای ترسیم نمودار خطی :
function drawLineChart()

{


       // For Drawing Line

       ctx.lineWidth = 3;

       var value = $('select#cphBody_DropDownList1 option:selected').val();

       // alert(value);

       ctx.beginPath();


       // *************** To Draw the Line and Plot Value in Line

       ctx.fillStyle = "#FFFFFF";

       ctx.strokeStyle = '#FFFFFF';

       ctx.moveTo(getXPlotvalue(0), getYPlotVale(value));


       ctx.fillStyle = "#000000";

       ctx.font = '12pt Calibri';

       ctx.fillText(value, getXPlotvalue(0), getYPlotVale(value) - 12);


       var ival = 0;

       $('#cphBody_DropDownList1 option').each(function () {


           if (ival > 0)

         {

               ctx.lineTo(getXPlotvalue(ival), getYPlotVale($(this).val()));

               ctx.stroke();


               ctx.fillStyle = "#000000";

               ctx.font = '12pt Calibri';

               ctx.fillText($(this).val(), getXPlotvalue(ival), getYPlotVale($(this).val()) - 16);

           }

           ival = ival + 1;

           ctx.fillStyle = lineColor;

           ctx.strokeStyle = lineColor;

       });


       // *************** To Draw the Line Dot Cericle


       //For Outer Blue Dot


       ival = 0;

       $('#cphBody_DropDownList1 option').each(function () {

           ctx.fillStyle = lineOuterCircleColor;

           ctx.strokeStyle = lineOuterCircleColor;

           ctx.beginPath();

           ctx.arc(getXPlotvalue(ival), getYPlotVale($(this).val()), 7, 0, Math.PI * 2, true);

           ctx.fill();


           ctx.fillStyle = lineInnerCircleColor;

           ctx.strokeStyle = lineInnerCircleColor;

           ctx.beginPath();

           ctx.arc(getXPlotvalue(ival), getYPlotVale($(this).val()), 4, 0, Math.PI * 2, true);

           ctx.fill();

           ival = ival + 1;

       });


       ctx.lineWidth = 1;

}
یا ترسیم نمودار دایره ای با متد ()drawPieChart :
using “arc” method.

function drawPieChart()
{

      var lastend = 0;
      var XvalPosition = xSpace;

      chartWidth = (canvas.width / 2) - xSpace;
      chartHeight = (canvas.height / 2) - (xSpace / 2);

      widthcalculation = parseInt(((parseInt(chartWidth) - 100) / noOfPlots));

      //Draw Xaxis Line
      //-- draw bar X-Axis and Y-Axis Line
      var XLineStartPosition = xSpace;
      var yLineStartPosition = xSpace;
      var yLineHeight = chartHeight;
      var xLineWidth = chartWidth;

      colorval = 0;
      var chartTotalResult = getChartTotal();

      $('#cphBody_DropDownList1 option').each(function ()
    {
          ctx.fillStyle = pirChartColor[colorval];
          ctx.beginPath();
          ctx.moveTo(chartWidth, chartHeight);
          //Here we draw the each Pic Chart arc with values and size.
          ctx.arc(chartWidth, chartHeight + 6, chartHeight, lastend, lastend +
            (Math.PI * 2 * (parseInt($(this).val()) / chartTotalResult)), false);

          ctx.lineTo(chartWidth, chartHeight);

          ctx.fill();
          lastend += Math.PI * 2 * (parseInt($(this).val()) / chartTotalResult);

          //END Draw Bar Graph  **************==================********************
          colorval = colorval + 1;
      });
  }
ترسیم نمودار دایره ای (نمودار پیراشکی) :
function drawDonutChart()
{
     var lastend = 0;
     var XvalPosition = xSpace;

     chartWidth = (canvas.width / 2) - xSpace;
     chartHeight = (canvas.height / 2) - (xSpace / 2);

     widthcalculation = parseInt(((parseInt(chartWidth) - 100) / noOfPlots));
     var donutOutercircle = chartHeight / 2;
     var donutinnersircle = (chartWidth / 2) + xSpace;

     colorval = 0;
     var chartTotalResult = getChartTotal();

     var legend1 = 0
     $('#cphBody_DropDownList1 option').each(function ()
    {

         ctx.fillStyle = pirChartColor[colorval];
         legend1 += (Math.PI * 2 * (parseInt($(this).val()) / chartTotalResult))
         //----
         ctx.beginPath();
         ctx.moveTo(chartWidth, chartWidth);
         ctx.arc(chartWidth, chartWidth, donutOutercircle, lastend, legend1, false); // Outer: CCW
         ctx.arc(chartWidth, chartWidth, donutinnersircle, legend1, lastend, true); // Inner: CW
         //------

         ctx.fill();
         lastend += Math.PI * 2 * (parseInt($(this).val()) / chartTotalResult);

         //END Draw Bar Graph  **************==================********************
         colorval = colorval + 1;
     });
 }
و برای ترسیم نمودار حبابی از متد ()BubbleChart استفاده می کنیم :
 function drawBubbleChart()

{


     // *************** To Draw the Line Dot Cericle

     ctx.globalAlpha = 0.8;

     //For Outer Blue Dot

     var bubbleSize = 40;

     ival = 0;

     $('#cphBody_DropDownList1 option').each(function ()

     {


         ctx.fillStyle = pirChartColor[ival];

         ctx.strokeStyle = pirChartColor[ival];

         ctx.beginPath();

         ctx.arc(getXPlotvalue(ival) + 14, getYPlotVale($(this).val()), bubbleSize, bubbleSize, Math.PI * 2, true);

         ctx.fill();

         ival = ival + 1;

     });


     ctx.lineWidth = 1;


 }
حال میتوانیم با استفاده از قطعه کد زیر نمودار ترسیم شده بر اساس داده های دلخواه ما را به صورت تصویر ذخیره و سپس دانلود کرد.
function ShanuSaveImage()
{
     var m = confirm("Are you sure to Save ");
     if (m)
     {
         if (navigator.appName == 'Microsoft Internet Explorer')
         {

             var image_NEW = document.getElementById("canvas").toDataURL("image/png");
             image_NEW = image_NEW.replace('data:image/png;base64,', '');

             $.ajax({
                 type: 'POST',
                 contentType: 'application/json; charset=utf-8',
                 url: '/shanuHTML5PIEChart.aspx/SaveImage',
                 data: '{ "imageData" : "' + image_NEW + '" }',
                 async: false,
                 success: function (msg) {
                     alert(msg.d);
                 },
                 error: function () {
                     alert("Pie Chart Not Saved");
                 }

             });
         }
         else
         {
             // save image without file type
             var canvas = document.getElementById("canvas");
             document.location.href = canvas.toDataURL("image/png").replace("image/png", "image/octet-stream");

             var ImageSave = document.createElement('a');
             ImageSave.download = "shanuPIEImage.png";
             ImageSave.href = canvas.toDataURL("image/png").replace("image/png", "image/octet-stream");
             ImageSave.click();
             alert("Image Saved");
         }
     }

 }
خروجی نمودار ها :
دقت داشته باشید به دلیل استفاده از HTML5 باید از نسخه های جدید تر مرورگر ها استفاده کنید.
پروژه ای که در ضمیمه قرار داده شده به وسیله Google Chrome ، Mozilla FireFox و IE10 تست شده است.


- ASP.net
- 4k بازدید
- 4 تشکر